I have lived in five different states over my 51 years on this earth. And each one of those places, the counties where I have lived before and still live today, have a legacy of slavery.
This would hardly bear remarking upon if I had spent my entire life in the South, rather than just the first 21 years or so. But whether Florida, Virginia, Pennsylvania, Connecticut, or Michigan, every place I’ve ever lived has a history of human bondage.
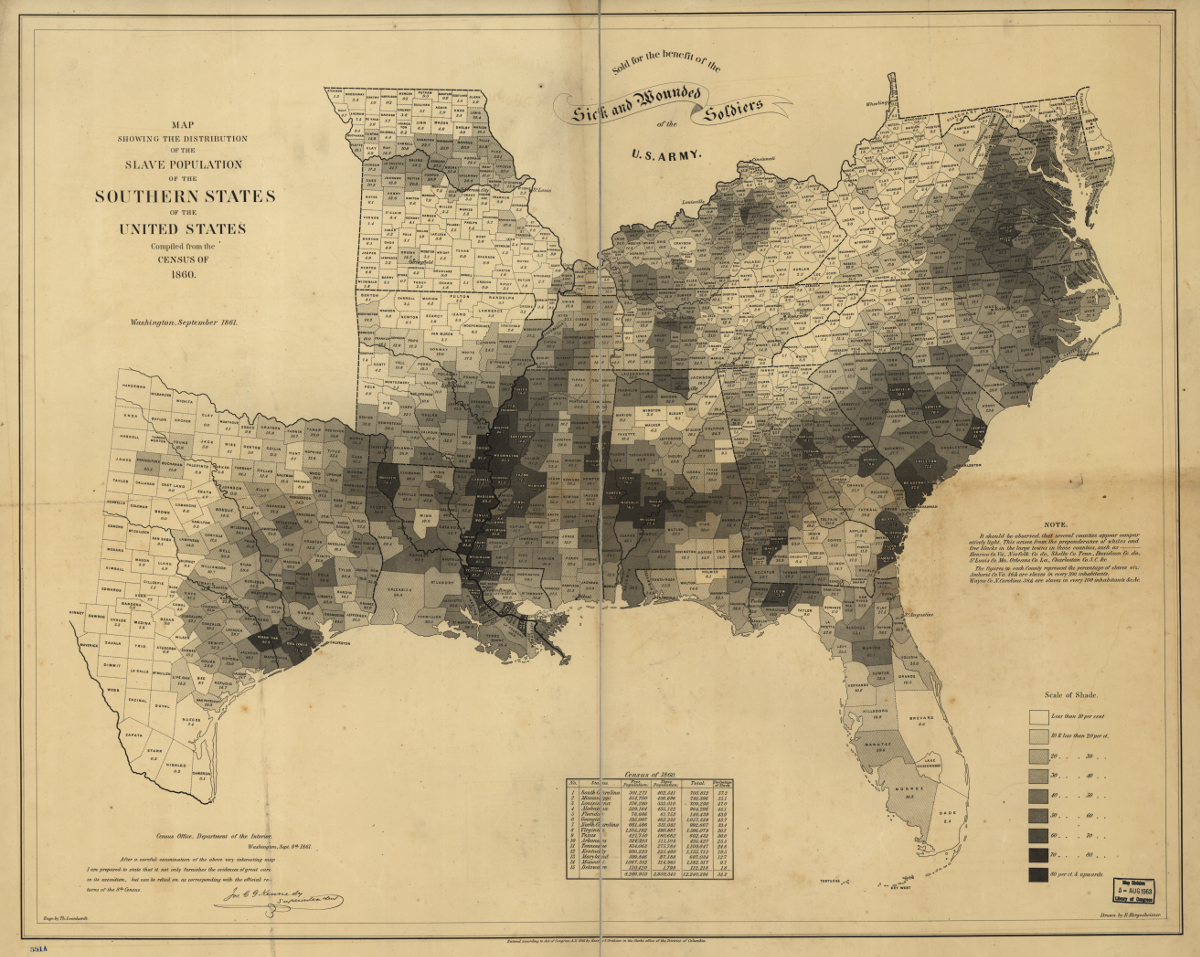
I know this thanks to a fascinating interactive map created by George Mason University historian Lincoln Mullen showing the spread of slavery from 1790 to 1860, as recorded in US Census figures. As Mullen explains:
Maps can help, especially interactive web maps that make it possible to zoom in and out, to represent more than one subject of interest, and to set representations of the past in motion in order to show change over time.
For me, the value of Mullen’s maps is as a reminder of the ubiquity of slavery in American history and the American experience. I knew that the southern counties where I lived had a slave past. But the rest? It’s a powerful reminder that the enduring legacy of slavery in American society is a shared burden, not one that smug Yankees like me can so easily lay solely on the shoulders of our southern brethren.
So here’s my personal geography of slavery, laid out in narrative style:
I was born in 1964 in Daytona Beach, Fla. In the 1830 census this was part of Mosquito County, and nearly 90 percent of the tiny population (only 733 people) at that time were African slaves or their descendants. By 1850 this was part of Orange County, and the population had dropped nearly by half. But almost half of those, 49 percent, were slaves. In 1860 this was now Volusia County, and slaves accounted for 26 percent of the population.
When I was four or five, my family moved to Okeechobee, Fla., a small town in what was a largely uninhabited wilderness in the decades before the Civil War. The 1850 census recorded only 139 people in all of what was then St. Lucie County, 19 percent of whom were slaves. In 1860 this was part of Brevard County, a vast expanse with a total population of only 246. Almost nine percent of those were slaves.
While I was still in college my family moved north to Luray, Va. In 1790 this was part of Shenandoah County and slaves made up nearly five percent of the population. That grew to 5.7 percent in 1800, 7.6 percent in 1810, 10 percent in 1820, and 12.3 percent in 1830. By the 1840 census Shenandoah County had split in two, with Luray in Page County where slaves made up 12.6 percent of the population. This figure stayed the same in the 1850 census, but by 1860 the slave population had exploded to 48 percent of the county’s total 21,706 people.
In 1982 I was in college at Lehigh University in Bethlehem, Pa., where I lived for the three years following my graduation in 1986. I had moved north, but I hadn’t escaped the legacy of slavery. Northampton County reported slaves in both the 1790 and 1800 censuses, and while they represented less than one-tenth of one percent of the population, they were there nonetheless.
Likewise Connecticut, where I moved, along with my wife, in 1989. We settled first in Enfield, Hartford County, where in 1790, 1800, 1810, and 1820 the census recorded a slave population. As in Pennsylvania the numbers were tiny, never even approaching one percent. But slavery all the same. We moved to Hebron a few years later, in Tolland County. Once again we followed the legacy of slavery, with slaves recorded in each census from 1790 to 1830.
Finally, in 2002, my family and I moved to Lake Orion, MI. And even here, slavery had preceded us. In 1810 where we live was part of the Huron District of the Michigan Territory. The total recorded population of only 580 people included two slaves. By the time of the 1830 census this area was now part of Oakland County, with a total free population of 4,910. And one slave.
Turns out I’ve lived my entire life in slave states. I just never knew it.